Appendix B
Why Is There No Curves Tool for Luminosity?
Ultimately the usefulness of an image depends upon how accurately it relates to our remembered visual experience. The property we perceive in an image in establishing this relationship is tonal value, or luminosity.
The luminosity histogram can only be accessed in an image processing program such as Photoshop, that is after the scan is made. Ideally one would like to monitor luminosity in the scanning program also. I've found that for most applications the RGB histogram, which in reality is the sum of the underlying three colors, is pretty close to the luminosity histogram, and when one is scanning in grayscale that's exactly what one is looking at. When working in color we're limited to modifying luminosity, our criterion of interest, indirectly by applying a curve to the RGB components. Yet in certain situations, especially when working with small areas, one would think a tool to operate directly on luminosity would be obvious.
Luminosity, as we've seen earlier, is a synthetic value calculated by applying weightings to the underlying red, green, and blue components. Because the 3 components have unequal weightings, there is no curves tool for luminosity. Applying a curve to two colors of the same luminosity would result in differing values.
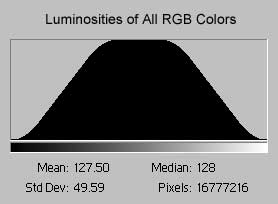
In the type of picture we're talking about in this tutorial, 24-bit color pictures, there are 3 color channels, each varying from 0 to 255. This means there are 16,777,216 (28+8+8) possible colors. The distribution of the 16,777,216 colors as they are translated into the 256 luminosity values is uneven. For example, 36,421 colors have a luminosity of 39; 7 colors have a luminosity of 0; and 111,906 colors have a luminosity of 128.
As an example, here is a grid of 8 randomly chosen colors (from the 99,473 possible) with a luminosity of 171:

fig. 1 |
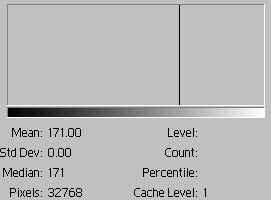 |
The 8 colors in the image in fig. 1 have the same tonal value and therefore appear as the same observation in the luminosity histogram.
For such a carefully contrived image with few colors, the RGB histogram bears no resemblance to the luminance histogram and thus is an unsuitable proxy:
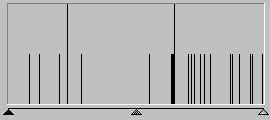 fig.
2. RGB Histogram for fig. 1
fig.
2. RGB Histogram for fig. 1
Suppose we apply an RGB curve to fig. 1 to get:

fig. 3 |
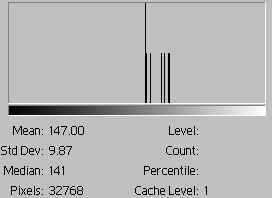 |
Note that the squares no longer contain colors of the same luminosity, showing that the same RGB curve affects colors of the same luminosity differently. The curve has resulted in a decreased mean luminance, 147; the image has been darkened.
On the other hand, if we were to employ a top-down method instead -- calculate the luminosity and modify the components -- color balance would be altered.
Something very close to manipulating luminosity directly is possible by converting the image to L*A*B mode and applying curves and levels against the "lightness" channel. Switching color spaces is beyond the scope of this brief tutorial, and the user should be familiar with the possible consequences before doing so. (In other words, experiment with them but keep a copy of the original!)
![]()