|
Contents Understanding Image Histograms and Curves Histograms Histograms and Pixel Structure Using Histograms as a Scanner Tool Image Exposure and Tone Curves Changing Brightness and Contrast Interactive Demos Appendices The Photoshop Levels Function and Curves |
Modifying Brightness and Contrast
|
|
|
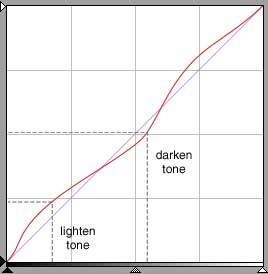
The properties of the tone curve (red, above) imply
|
A tone is darkened (lowered in value) if the input tone intersects the curve below the 45º diagonal | |
|
A tone is lightened (increased in value) if the input tone intersects the curve above the 45º diagonal | |
|
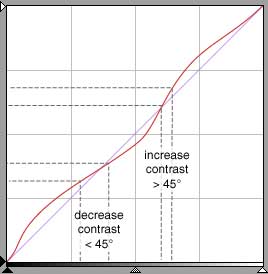
The contrast between two tones is increased if the interval between the two tones is increased | |
|
The contrast between two tones is decreased if the interval between the two tones is decreased |
Here is what we do
| To lighten an image, grab the tone curve at the center and drag it slightly upwards above the 45º diagonal. Illustration | |
| To darken an image, grab the tone curve at the center and drag it slightly downwards below the 45º diagonal. Illustration | |
| To increase contrast, grab the tonal curve at a darker tone interval and drag it slightly down. Then grab the tonal curve at a lighter tone interval and drag it slightly up. This forms a characteristic "S" curve. You form the "S" between the two points between which the contrast is to be increased. Illustration | |
| To decrease contrast, grab the tonal curve at a darker tone interval and drag it slightly up. Then grab the tonal curve at a lighter tone interval and drag it slightly down. This forms a reverse "S" curve. Illustration |
The end-points are absolute, 0 and 255, so the contrast between black and white cannot be increased. (In this tutorial, I imply two types of contrast: local and global. Local for contrast between two tones. For an entire image's contrast, since the end-points are fixed, I look at the histogram's standard deviation as an indicator.) We can, however, increase the contrast between two points if one is not lying on an extreme. Increasing the slope of the curve* between the 2 points to more than 45º has the effect of spreading an input tones over a wider interval of the output line.
When I say slight, I mean slight. To increase contrast in one range of tones means to decrease contrast in another. If you go too far, tones in the increased contrast area will start to lose their continuity and posterize (fewer tones are distributed into a larger number space), and tones in the decreased area will begin to merge (more tones are squeezed into a few values). We're restricted to working within a very small interval of 256 numbers--a zero-sum game. We can perform adjustments on an image, not miracles. Even the most expert scan cannot compensate for a lack of tonal range in the source image.
Keep in mind that each pixel in a color image is a composite of red, green, and blue values. When an RGB curve is applied to an image, the scanner software or image editing program applies the curve to the underlying components separately.
The effect of tone curve slope
A note on setting the B/W points
An interactive demonstration of curves (requires Java enabled browser)
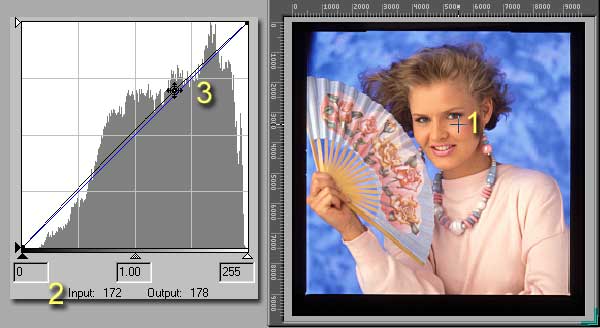
Identifying Tonal Areas as Grab Points
Of course, when we modify a curve we don't grab just any point, we manipulate the curve with specific tonal areas in mind.
|
|
Changes in contrast requires that two points be identified. An increase in contrast is achieved by moving the two points so that the slope, or angle, of a line drawn through them is increased. A decrease in contrast is achieved by moving the two points so that the slope, or angle, of a line drawn through them is decreased.
With practice, knowing where to grab the tone curve becomes almost a natural reflex.
Ameliorating the Loss of Tonal Separation
There are three methods to address the distortions caused by the application of tone curves:
-
Scan at double the resolution, apply curves, and down sample to the lower resolution This method relies on the down sampling process to average out errors. This is expensive in storage and CPU resources.
-
Scan at a greater bit-depth apply curves and down sample to 8-bits This is the most common method employed to minimize the effects of tone shifts due to curves. The Nikon LS-2000 has a provision to scan at 12-bits. This means that instead of a tonal range of 256 tones, there are 4096, a 16 times finer tonal resolution. The cost is a doubling of file size. Extra bit scanning should be considered in the critical scanning of color negatives: A Brief Note on Scanning Color Negative Film.
-
Do nothing Some applications simply do not require very high image quality. Tonal distortions would not be visible or of little concern to the end-user. This is particularly true of images destined for Web page display, which benefit more from an adroit application of an unsharp mask.
That's the theory and received wisdom. In practice, it's rare that methods 1 and 2, although resulting in better looking histograms, ever result in visually improved images. The one possible exception arises when scanning a transparency with important shadow detail or a transparency that is underexposed. If the source image is properly exposed and won't undergo extensive tonal modification, 8+-bit scanning is a bit of a waste. In any case, if you're determined to scan at greater bit depths be sure to use multi-sampling. It makes little sense to attempt to obtain the benefits of the precision of 8+-bit depth scanning without the increased accuracy of multi-sampling.
You might wonder what the role of the sliders might be in the method I have outlined. Simply speaking, none. I hate to sound preachy and dogmatic, but if there's anything I feel strongly about, it's that one should not use the sliders to adjust contrast, brightness, or color balance in creating a final scan. This is not especially because in NikonScan these adjustments are not reflected in the histogram, thus giving you no objective feedback, but because the effects of the sliders are so crude and thus work against the objectives of proper tonal correction. This may be demonstrated by analyzing the sliders as tone curves.
Brightness slider control demonstration
Contrast slider control demonstration
Naturally, this remonstrance applies equally to using the tone control sliders in imaging editing programs such as Photoshop.
![]()
![]()
![]()
* So closely are tone curves associated with the concept of slope that some refer to them as gamma curves--functions used in photography which relate exposure to emulsion density.