|
Contents Understanding Image Histograms and Curves Histograms Histograms and Pixel Structure Using Histograms as a Scanner Tool Image Exposure and Tone Curves Changing Brightness and Contrast Interactive Demos Appendices The Photoshop Levels Function and Curves |
Color Channels and Luminosity
The great majority of Photoshop histograms used in this tutorial display luminosity, or brightness. In the RGB color system, the predominant color system of non-professional scanning, this channel exists as a composite value, or in the current idiom, a "virtual" channel calculated from the levels of red, green, and blue.
|
|
Gray is a composite of |
|
|
|
|
<127, 127, 127> Luminosity: 127 |
is the sum of |
red <127, 0, 0> + Luminosity: 38 + |
green <0, 127, 0> + Luminosity: 75 + |
blue <0, 0, 127> Luminosity: 14 |


fig. 5.
Note the weights for luminosity assigned to the three colors: 0.30 : 0.59 : 0.11. Green is weighted 5.4 times that of blue! Human vision is much more sensitive to green and the weightings reflect the relative sensitivities. This unequal effect on luminosity should be kept in mind when one adjusts the separate color channels.
A Bar in the Luminosity Channel May Count Pixels of Different Colors
|
fig. 6 |
|

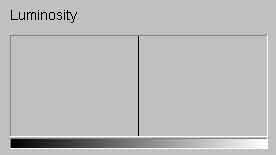
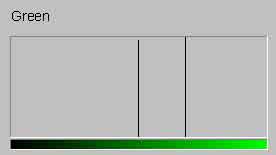
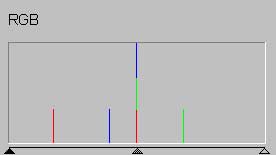
The left half of fig. 6 is the same gray as in fig. 5. The color in the right half, also a composite of RGB, was contrived such that it also has a luminosity of 127. As a result the luminosity histogram for the image results in all the image's pixels being observed in the same bar. The histogram for the green channel, however, shows two bars. The center bar is associated with the gray in fig. 6 and the bar to the right of it is the green component of the right half of fig. 6. The RGB histogram is a sum of the three underlying channels: red, green, and blue. The three components of the green half appear as the smaller bars in the rightmost histogram for RGB. The center bar reflects the 3 components of the gray half of fig. 6.
Why Luminosity?
To the human eye, brightness rather than hue is the quality that is more important in perceiving images. This is merely confirmation of what those who produce images, whether in the darkroom or in the computer, instinctively do in practice: correct brightness before color balance. Ideally one would use the luminosity histogram to apply and assess changes in brightness or contrast. The problem is that luminosity is not available in most scanning programs and is available with some inconvenience in Photoshop. (This is no longer the case since the release of version 8.)
The RGB histogram is a cumulative enumeration of its underlying red, green, and blue components, and unlike the luminosity histogram, does not summarize a visually apparent quality. That is one can perceive redness, greenness, blueness, brightness (luminosity), but not "rgbness". You'll use the RGB histogram in performing the scan because it clearly identifies the "outliers," or values that book-end the tonal scale of the image. Once the image has been acquired, however, we're more interested in analyzing and modifying what's between those ends -- how tones are distributed throughout the image. The luminosity histogram is the tool to do this. In practice, as long as the image is large enough and the black-white point settings have been applied, I've found that the RGB histogram often, but not always, approximates the luminosity histogram in indicating the location of peaks and end-points.
![]()
![]()